
Categories
Home in Allentown, Homes in Bethlehem, Homes in Easton, Market Trends, Lehigh Valley Market TrendsPublished October 29, 2025
A Decade+ of Change: Lehigh Valley Real Estate Market Trends 3rd Quarter 2014-2025


Since March 2014, I have been tracking 26 subsets of the Lehigh Valley real estate market. Every week, data is downloaded from the Greater Lehigh Valley Multiple Listing Service, and a market report is generated and saved. In this post, I will trend and compare the Northampton and Lehigh County real estate markets for the 3rd quarter of each year from 2014 to 2025.
I will look at historical data for the following metrics with charts to clearly illustrate the trends.
- Active, Pending, and Sold Units (Last 6 Months of Sold Units)
- Average and Median Days on the Market
- Sold Price Trends
- Average Price Changes Year-Over-Year
- Absorption Rates
- Pending Ratios
Active, Pending, and Sold Units: 2014-2025
For Northampton County, active inventory dropped significantly over the period: from 2,098 units in 2014 to 372 in 2025. Pending sales increased until 2020 (852), then fell steadily to 452 in 2025. Sold units peaked around 2019 (2,322), then contracted, rebounding slightly to 1,725 in 2025. 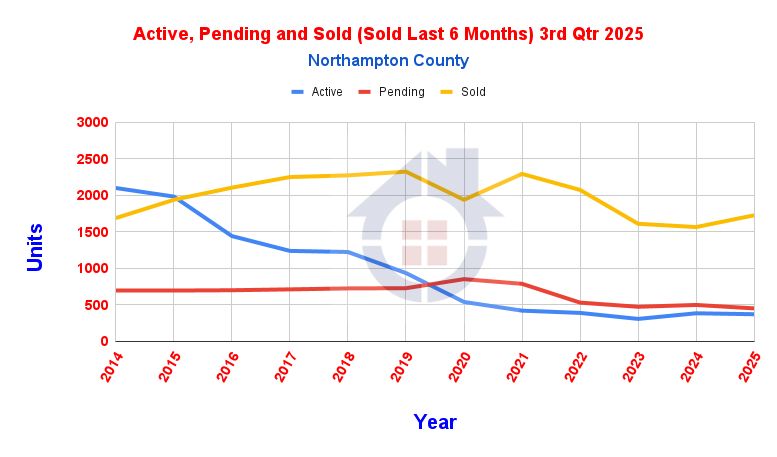
Lehigh County followed similar patterns: peak active units were 1,853 in 2015; by 2025, only 404 were active. Pending units in Lehigh climbed to 832 in 2021, but fell to 510 by 2025. Sold units trended upward to a high of 2,453 in 2017, but ended at 1,861 in 2025. This suggests tighter inventory, fewer buyers in recent years, and sales declining as supply and demand adjust.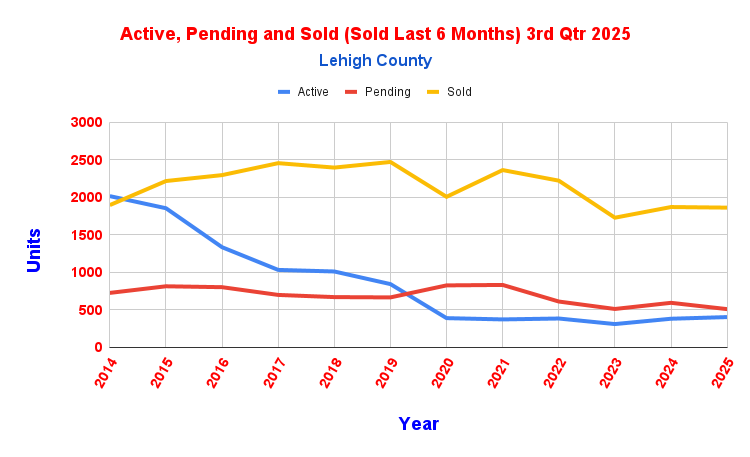
Active, Pending, and Sold Units: 2022-2025
For Northampton County, active inventory steadily declined from 390 units in 2022 to 372 in 2025. Pending sales dropped from 531 units in 2022 to 452 in 2025. Sold units started at 2,072 in 2022, fell to 1,609 in 2023, then fell again to 1,564 in 2024, before rebounding to 1,725 in 2025.
Lehigh County's active inventory declined from 385 units in 2022 to 311 units in 2023, then rebounded in 2024, settling at 404 units in 2025. Pending sales dropped from 611 units in 2022 to 510 in 2025. Sold units started at 2,220 in 2022, fell to 1,727 in 2022, then rebounded to 1,869 in 2024, before sliding to 1,861 in 2025.
Average Sold Price: 2014-2025
Northampton County’s average sold price rose from $211,390 in 2014 to $402,344 by 2025.
Lehigh started at $199,038 in 2014 and reached $402,052 in 2025.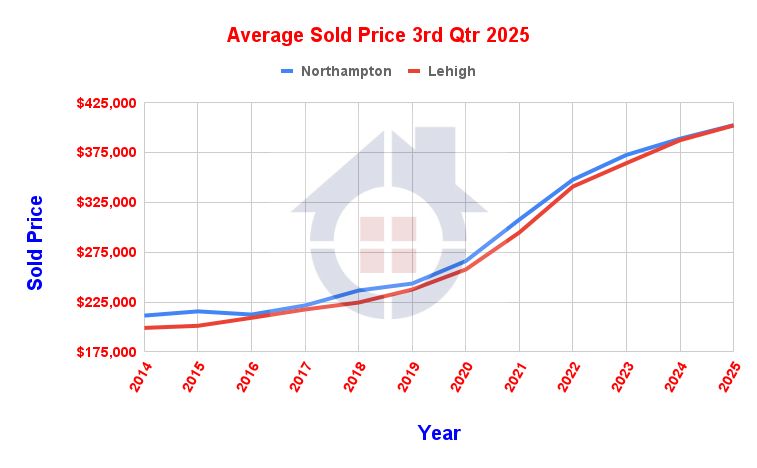
Both counties experienced consistent price growth, with the most notable jumps beginning in 2020, in line with nationwide market appreciation. Year-over-year price increases were especially prominent from 2020 onwards; prices in both counties more than doubled over the 11 years.
Median Sold Price: 2014-2025
Northampton County’s median sold price rose from $180,000 in 2014 to $357,000 by 2025.
Lehigh started at $169,900 in 2014 and reached $350,000 in 2025.
Price Comparison: Average vs. Median
The difference between the average and median prices, often expressed as a percentage, highlights the extent to which high-value properties influence the overall market statistics.
-
Average Price: The total dollar volume of all homes sold divided by the number of homes sold. It is sensitive to outliers, meaning a few very expensive home sales can significantly increase the average.
-
Median Price: The midway point of all sale prices. Half of all homes sold for more than the median, and half sold for less. It is a more stable indicator of the "typical" market value, as exceptionally high or low sale prices do not skew it.
Average vs Median Sold Price
The average sale price in both counties has consistently been higher than the median sale price across all years. This indicates that higher-priced properties are skewing the average upwards, a common scenario in markets with a mix of luxury or unique homes.
The median price provides a better indication of what a typical buyer paid, especially in years where a few high-end sales could distort the average. This is particularly relevant in robust markets, where most homes sell close to the median price and only a few trade at significantly higher values.
Outlier transactions have less influence on median prices and are more stable year over year. When the gap between the average and the median widens, it often means that luxury or exceptional sales are driving the average up. When the gap narrows, it suggests a more balanced overall price distribution, with fewer outliers.
Both counties saw strong growth in median and average prices since 2020, with median prices rising at a rate similar to average prices, reinforcing that price appreciation is broad-based across most segments.
Lehigh County
Lehigh County follows a similar pattern, with the average sale price consistently exceeding the median. The percentage difference has remained in the 12% to 15% range, indicating a stable and persistent influence from higher-end property sales throughout the period.
Northampton County
In Northampton County, the average sale price has consistently been between 9% and 15% higher than the median sale price from 2014 to 2025. The gap was wider in the earlier years and has seen a slight narrowing trend over time, suggesting that while the luxury market remains strong, price growth in the middle market has been robust.
Average and Median Days on Market (DOM)
For both counties, average and median DOM have generally decreased over the years, indicating a quicker turnaround in listings.
Average DOM is the total number of days properties stayed on the market divided by total sales, skewed by outliers (very long or short sales).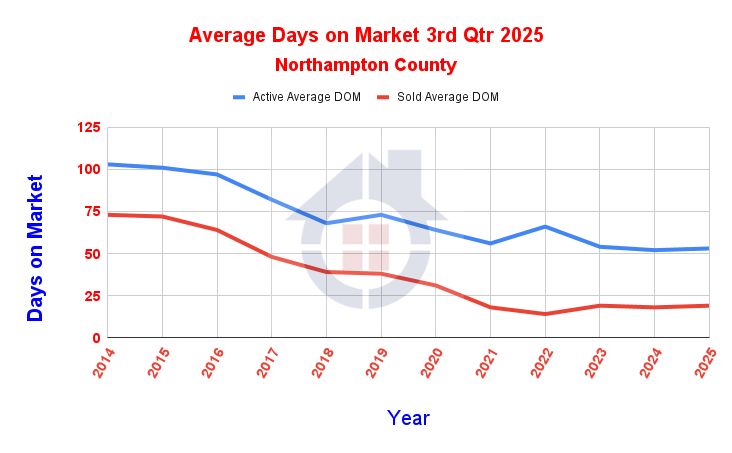
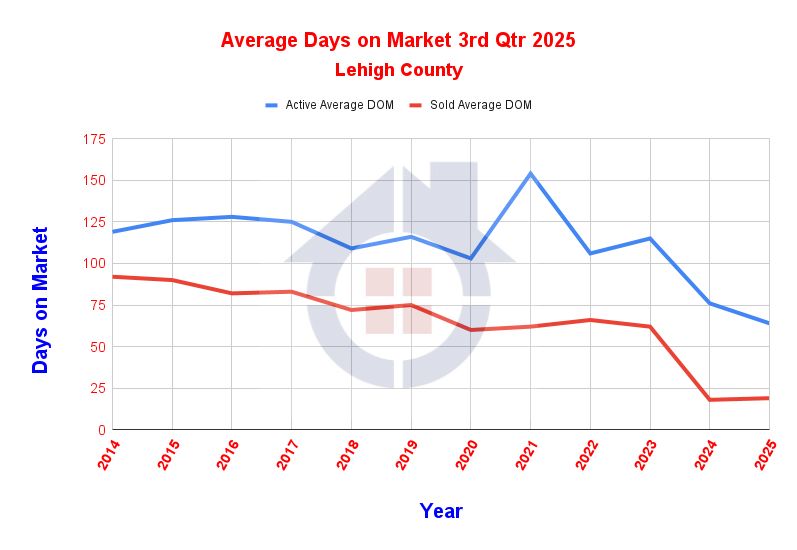
Median DOM is the middle value of days on market and is less sensitive to extreme values.
Northampton County’s Average DOM for active listings dropped from 103 days in 2014 to 53 days in 2025, while Median DOM for active listings dropped from 73 to 25 days. Average DOM for sold listings dropped from 73 days in 2014 to 19 days in 2025, while Median DOM for sold listings dropped from 44 to 8 days.
Lehigh County’s Average DOM for active listings dropped from 103 days in 2014 to 64 days in 2025, while Median DOM for active listings dropped from 74 to 37 days. Average DOM for sold listings dropped from 65 days in 2014 to 19 days in 2025, while Median DOM for sold listings dropped from 65 to 8 days
The difference between average and median suggests some listings may have stayed longer disproportionately, but the median gives a more robust indicator of typical selling time.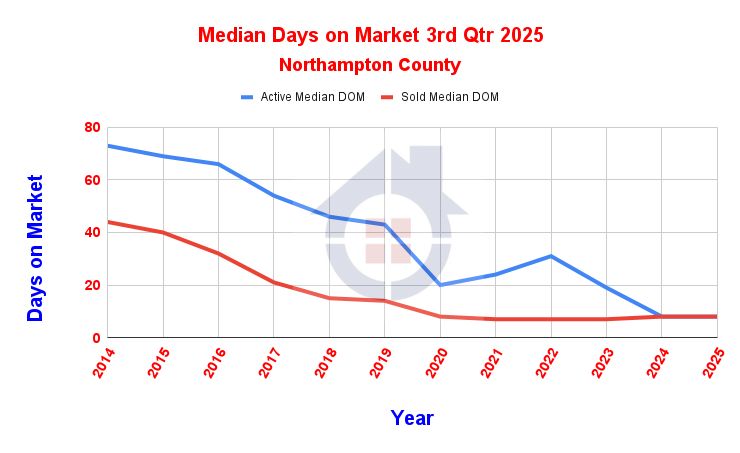
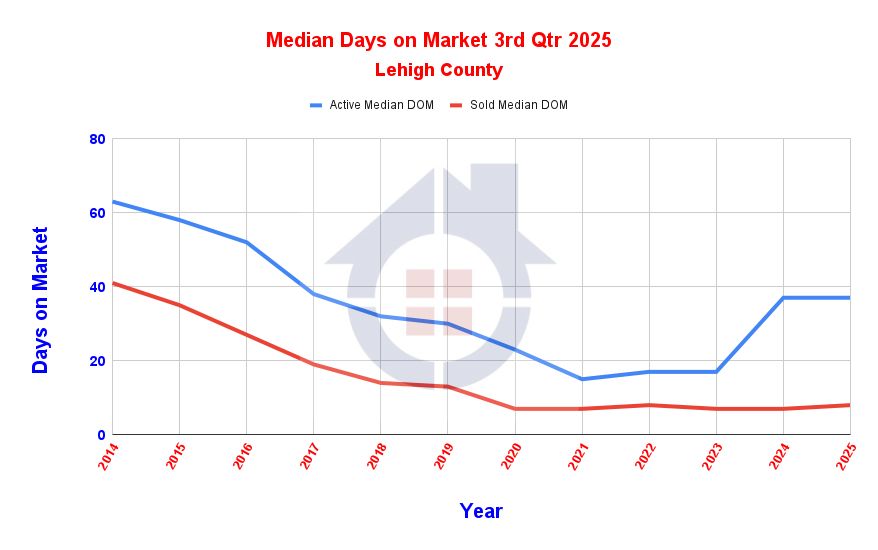
Another critical point to note is the difference between the DOM for active and sold listings, both in the average and median. When properties are not priced correctly, they tend to spend more time on the market.
Absorption Rate (Months)
The absorption rate estimates how fast listings are currently selling, measured in months. For example, if 100 properties sell per month and there are 800 properties for sale, there is an 8-month supply of inventory, before accounting for the additional properties that come on the market.
Absorption rate (estimated months to sell current inventory) has generally declined from 7.5 months in Northampton in 2014 to about 1.3 months in 2025, indicating increasing market velocity.
Lehigh County had a similar decline from 6.4 months in 2014 to approximately 1.3 months in 2025.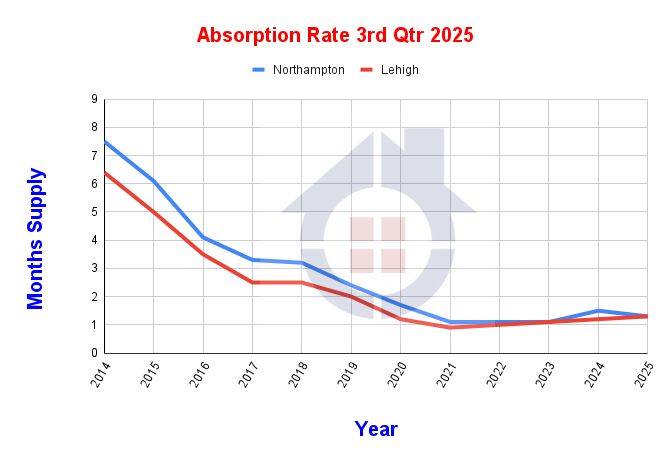
Pending Ratio (Pending/Sold)
The Pending Ratio indicates the supply and demand of the market. Specifically, a high ratio means that listings are in demand and quickly going to contract. Alternatively, a low ratio means insufficient qualified buyers for the existing supply.
Pending ratios have fluctuated between about 0.25 to 0.65 over the years.
Northampton’s ratio steadily increased from 0.25 in 2014 to around 0.55 in 2025.
Lehigh’s ratio started at 0.26 in 2014 and hovered around 0.56 in 2025.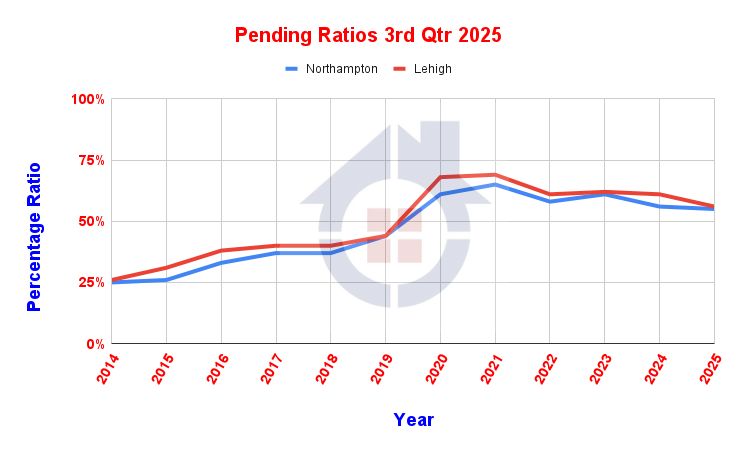
Price Change Analysis - 2015 to 2025
The chart below displays the average price change for the Lehigh and Northampton County markets from 2015 to 2025. Over this period, both counties generally experienced upward trends in average price changes, peaking in 2021 and 2022. Northampton County, represented by blue bars, saw its highest price increase at 15.64% in 2021, followed closely by 13.00% in 2022. Lehigh County, shown in red, peaked at 14.41% in 2021 and experienced a notable increase of 15.63% in 2022. Both counties then saw declines in the rate of price changes afterward, with Northampton’s average price change dropping to 3.43% and Lehigh's to 3.82% by 2025. Overall, the data illustrate a dramatic rise leading up to 2022, followed by a stabilization at moderate growth levels in the subsequent years. These moderate growth levels suggest a return to the Lehigh Valley real estate market's normal growth rate. This is a great time to enter the market. As rates start to drop and market activity increases, you can expect prices to rise above the Lehigh Valley norm.
|


or another way